

End-to-End articles for beginners & students to become Analytics Specialist, Analytics Engineer or Analytics Professionals such as Data Analyst, Data Scientist, Data Engineer, Machine Learning Engineer and Applied Researcher. This subscription will provide comprehensive end-to-end articles with codes & necessary explanations to kick start your journey in the broad field of Applied Statistics, Data Science, Machine Learning, Data Engineering, Forecasting & Advanced Data Analytics. Subscribe for free updates
Introduction
Counting individuals between two dates by age range is a common task in data analysis, particularly in demographic studies, healthcare analytics, and customer segmentation. This article walks you through an efficient way to achieve this using Python, covering everything from dataset simulation to filtering and visualization.
Understanding the Problem
Given a dataset containing birthdates, we need to determine how many individuals fall into predefined age ranges within a specific date range. The key steps involve:
- Correctly computing the age based on a reference date.
- Filtering individuals who exist within the given date range.
- Categorizing them into age groups.
- Counting and visualizing the results.
Setting Up the Python Environment
To implement this solution, we need the following Python libraries:
import pandas as pd
import numpy as np
import matplotlib.pyplot as plt
from datetime import datetime, timedelta
If you don't have these installed, you can install them using:
pip install pandas numpy matplotlibSimulating a Dataset
Since we are working with a simulated dataset, let's generate random birthdates for individuals within a realistic range.
# Set seed for reproducibility
np.random.seed(42)
# Generate random birthdates for 500 individuals (born between 1950 and 2015)
def generate_birthdate():
    start_date = datetime(1950, 1, 1)
    end_date = datetime(2015, 12, 31)
    random_days = np.random.randint(0, (end_date - start_date).days, 500)
    return [start_date + timedelta(days=int(days)) for days in random_days]
# Create a DataFrame
birth_dates = generate_birthdate()
df = pd.DataFrame({'ID': range(1, 501), 'Birthdate': birth_dates})
Calculating Age and Filtering by Date Range
We define a reference date (e.g., January 1, 2024) and calculate individuals' ages.
# Define the reference date
reference_date = datetime(2024, 1, 1)
# Calculate age
df['Age'] = df['Birthdate'].apply(lambda x: reference_date.year - x.year - ((reference_date.month, reference_date.day) < (x.month, x.day)))
Filtering Individuals Within a Given Date Range
Let's assume we are interested in individuals who existed between 2020-01-01 and 2024-01-01.
start_range = datetime(2020, 1, 1)
end_range = datetime(2024, 1, 1)
# Filter individuals born before the end date (alive during the period)
df_filtered = df[df['Birthdate'] <= end_range]
Counting Individuals by Age Group
We define age bins and categorize individuals into groups.
# Define age bins and labels
bins = [0, 18, 35, 50, 65, 100]
labels = ['0-18', '19-35', '36-50', '51-65', '66+']
# Assign age groups
df_filtered['Age Group'] = pd.cut(df_filtered['Age'], bins=bins, labels=labels, right=False)
# Count individuals per age group
age_group_counts = df_filtered['Age Group'].value_counts().sort_index()
Visualizing the Results
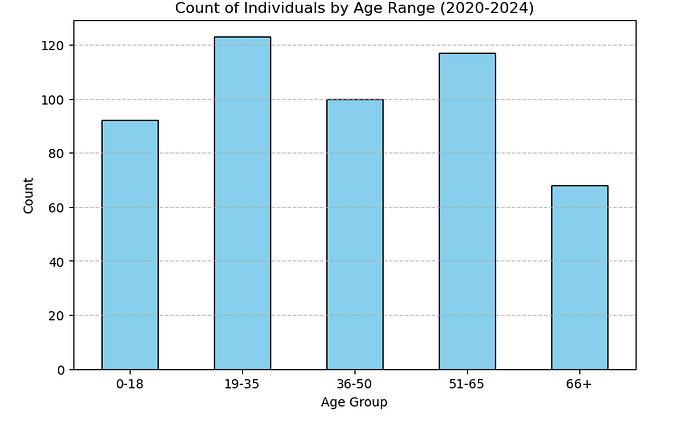
Using a bar chart to represent the count distribution by age group.
plt.figure(figsize=(8, 5))
age_group_counts.plot(kind='bar', color='skyblue', edgecolor='black')
plt.xlabel('Age Group')
plt.ylabel('Count')
plt.title('Count of Individuals by Age Range (2020-2024)')
plt.xticks(rotation=0)
plt.grid(axis='y', linestyle='--', alpha=0.7)
plt.show()
Full End-to-End Python Implementation
Below is the complete Python script for reference:
import pandas as pd
import numpy as np
import matplotlib.pyplot as plt
from datetime import datetime, timedelta
# Generate random birthdates
np.random.seed(42)
def generate_birthdate():
    start_date = datetime(1950, 1, 1)
    end_date = datetime(2015, 12, 31)
    random_days = np.random.randint(0, (end_date - start_date).days, 500)
    return [start_date + timedelta(days=int(days)) for days in random_days]
# Create dataset
df = pd.DataFrame({'ID': range(1, 501), 'Birthdate': generate_birthdate()})
# Reference date
reference_date = datetime(2024, 1, 1)
df['Age'] = df['Birthdate'].apply(lambda x: reference_date.year - x.year - ((reference_date.month, reference_date.day) < (x.month, x.day)))
# Filter for individuals existing between 2020-2024
start_range = datetime(2020, 1, 1)
end_range = datetime(2024, 1, 1)
df_filtered = df[df['Birthdate'] <= end_range]
# Define age bins and count by age range
bins = [0, 18, 35, 50, 65, 100]
labels = ['0-18', '19-35', '36-50', '51-65', '66+']
df_filtered['Age Group'] = pd.cut(df_filtered['Age'], bins=bins, labels=labels, right=False)
age_group_counts = df_filtered['Age Group'].value_counts().sort_index()
# Visualize results
plt.figure(figsize=(8, 5))
age_group_counts.plot(kind='bar', color='skyblue', edgecolor='black')
plt.xlabel('Age Group')
plt.ylabel('Count')
plt.title('Count of Individuals by Age Range (2020-2024)')
plt.xticks(rotation=0)
plt.grid(axis='y', linestyle='--', alpha=0.7)
plt.show()
Conclusion
In this guide, we demonstrated how to count individuals between two dates by age range in Python. We covered data simulation, age calculation, filtering, grouping, and visualization. This method can be expanded to real-world datasets for more complex analyses, including handling missing values and optimizing performance.